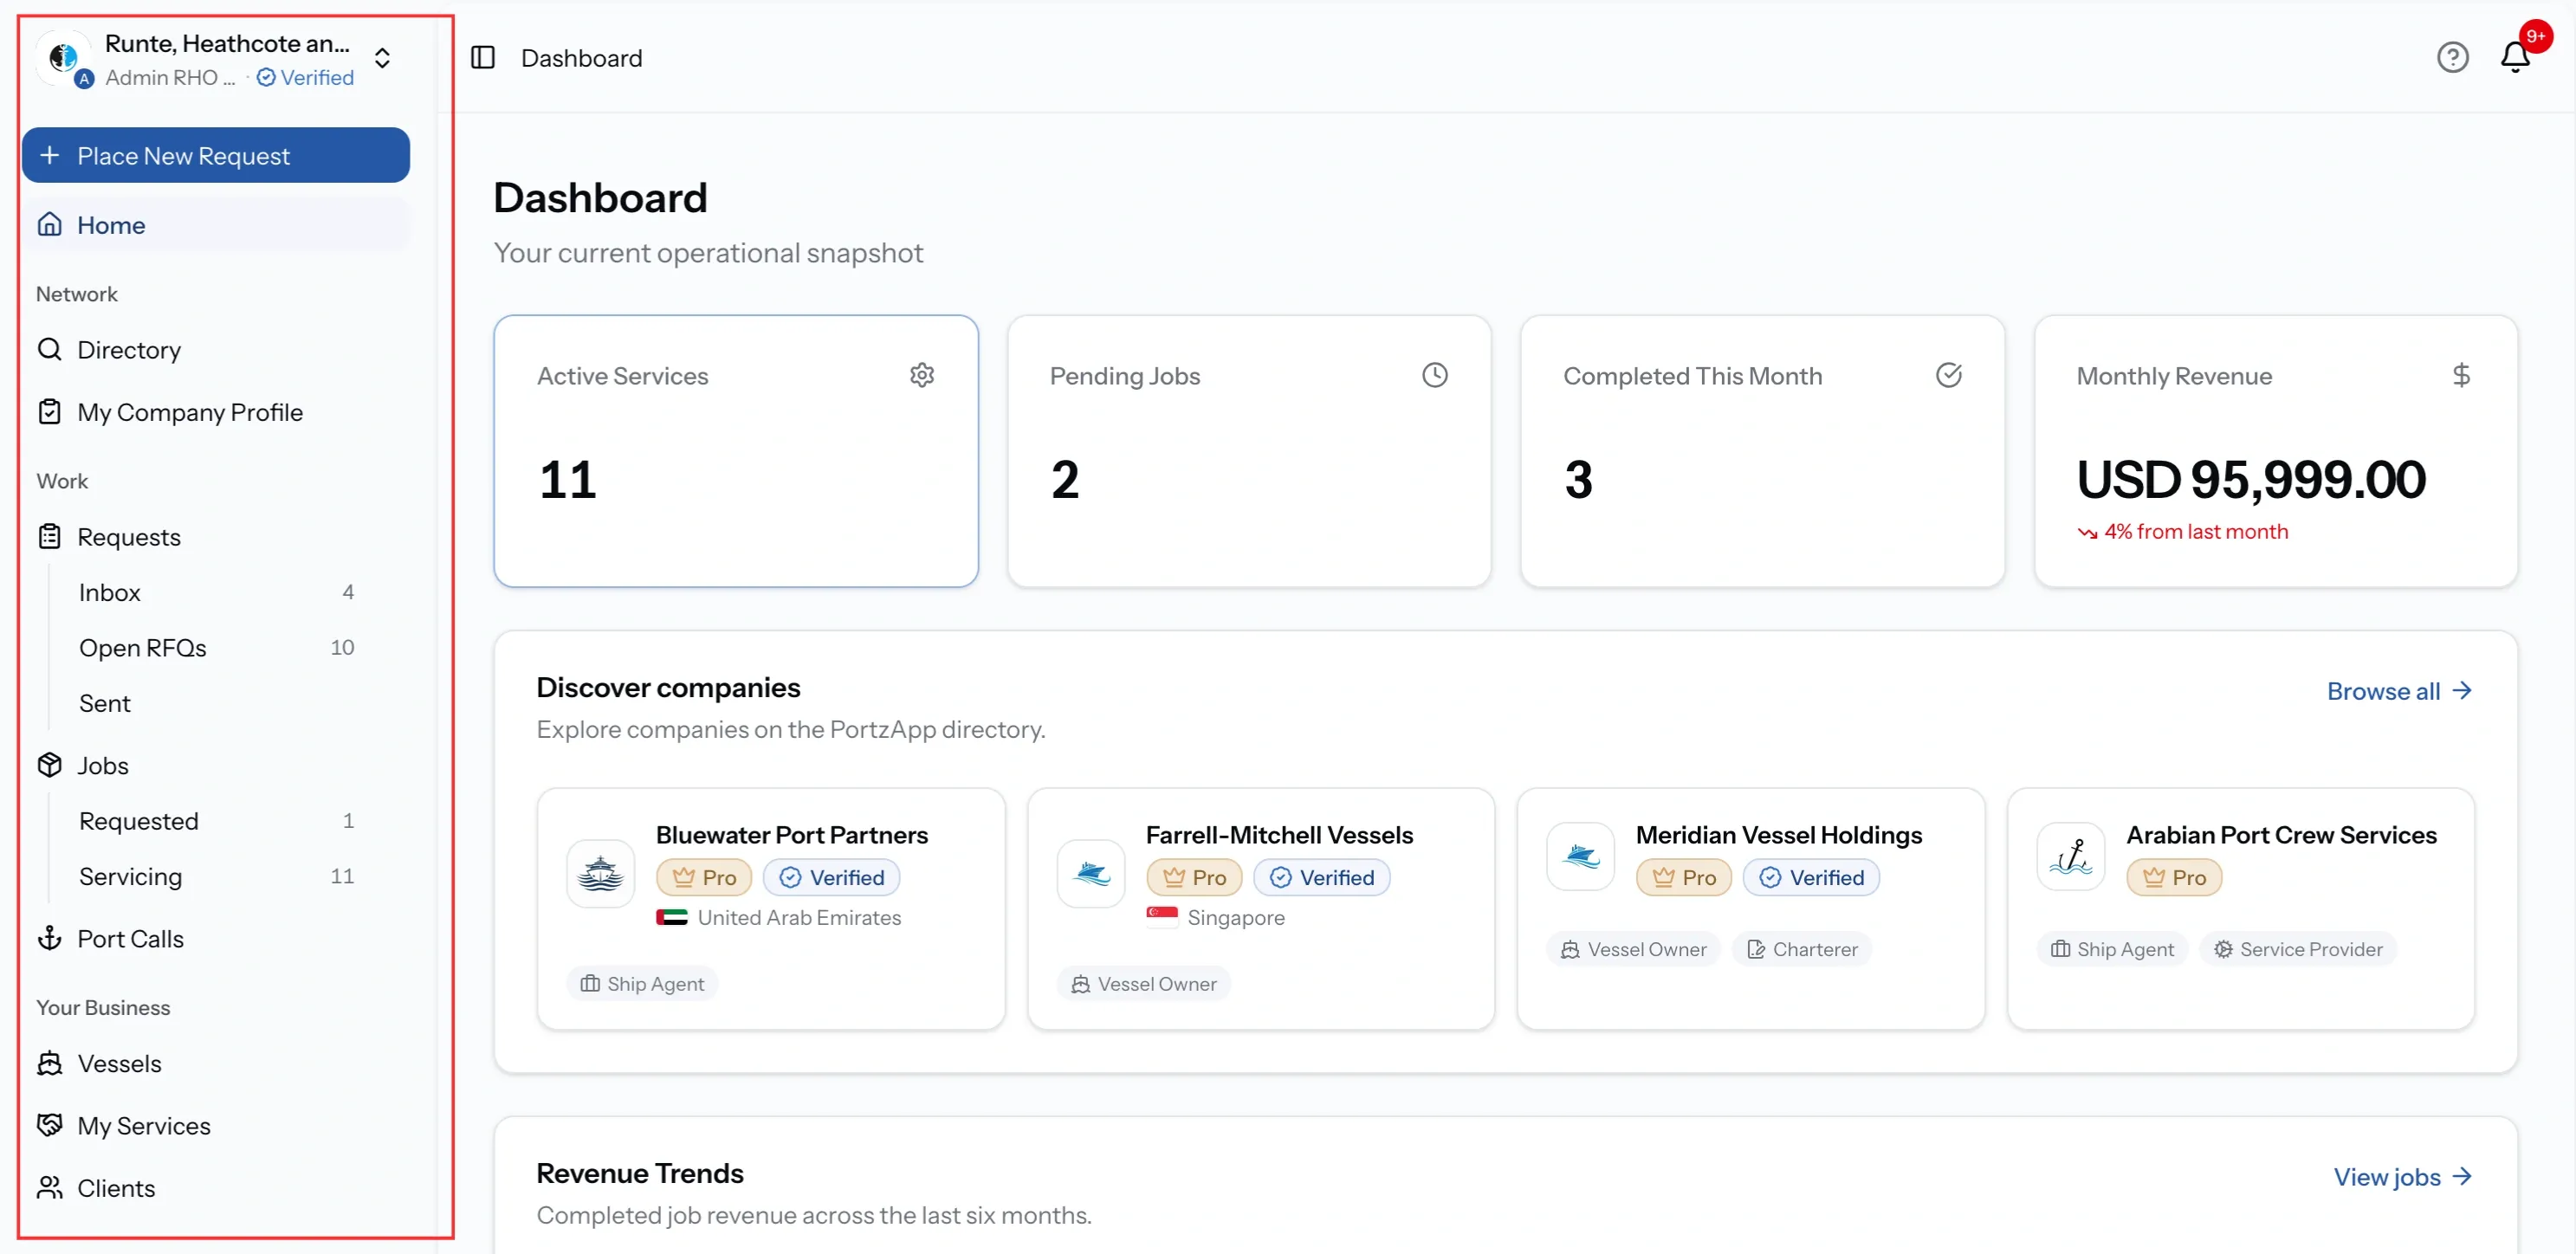
Dashboard
The dashboard is your operational snapshot in PortzApp. It shows what needs your attention now: the counts that matter to your organization, suggested companies from the directory, your six month trend, and the port calls currently in progress.
FOR BUYERS & PROVIDERS
Everyone with an organization sees a dashboard, but not the same one. What appears depends on whether your organization is a buyer, a provider, or both, as well as your role. Monthly Revenue and revenue trends are available to Admin, CEO, Manager, and Finance roles.
Key takeaways
- The dashboard adapts to your organization. Buyers see fleet and job activity; providers see service, job and revenue activity
- Revenue widgets are visible only to roles with financial access: Admin, CEO, Manager, and Finance.
- Active Port Calls and job trends give you a quick view of ongoing and changing activity.
- Dashboard shortcuts let you open detailed pages or start a new request quickly.
Opening the dashboard
Select Home in the sidebar. The dashboard is also where you land after signing in.
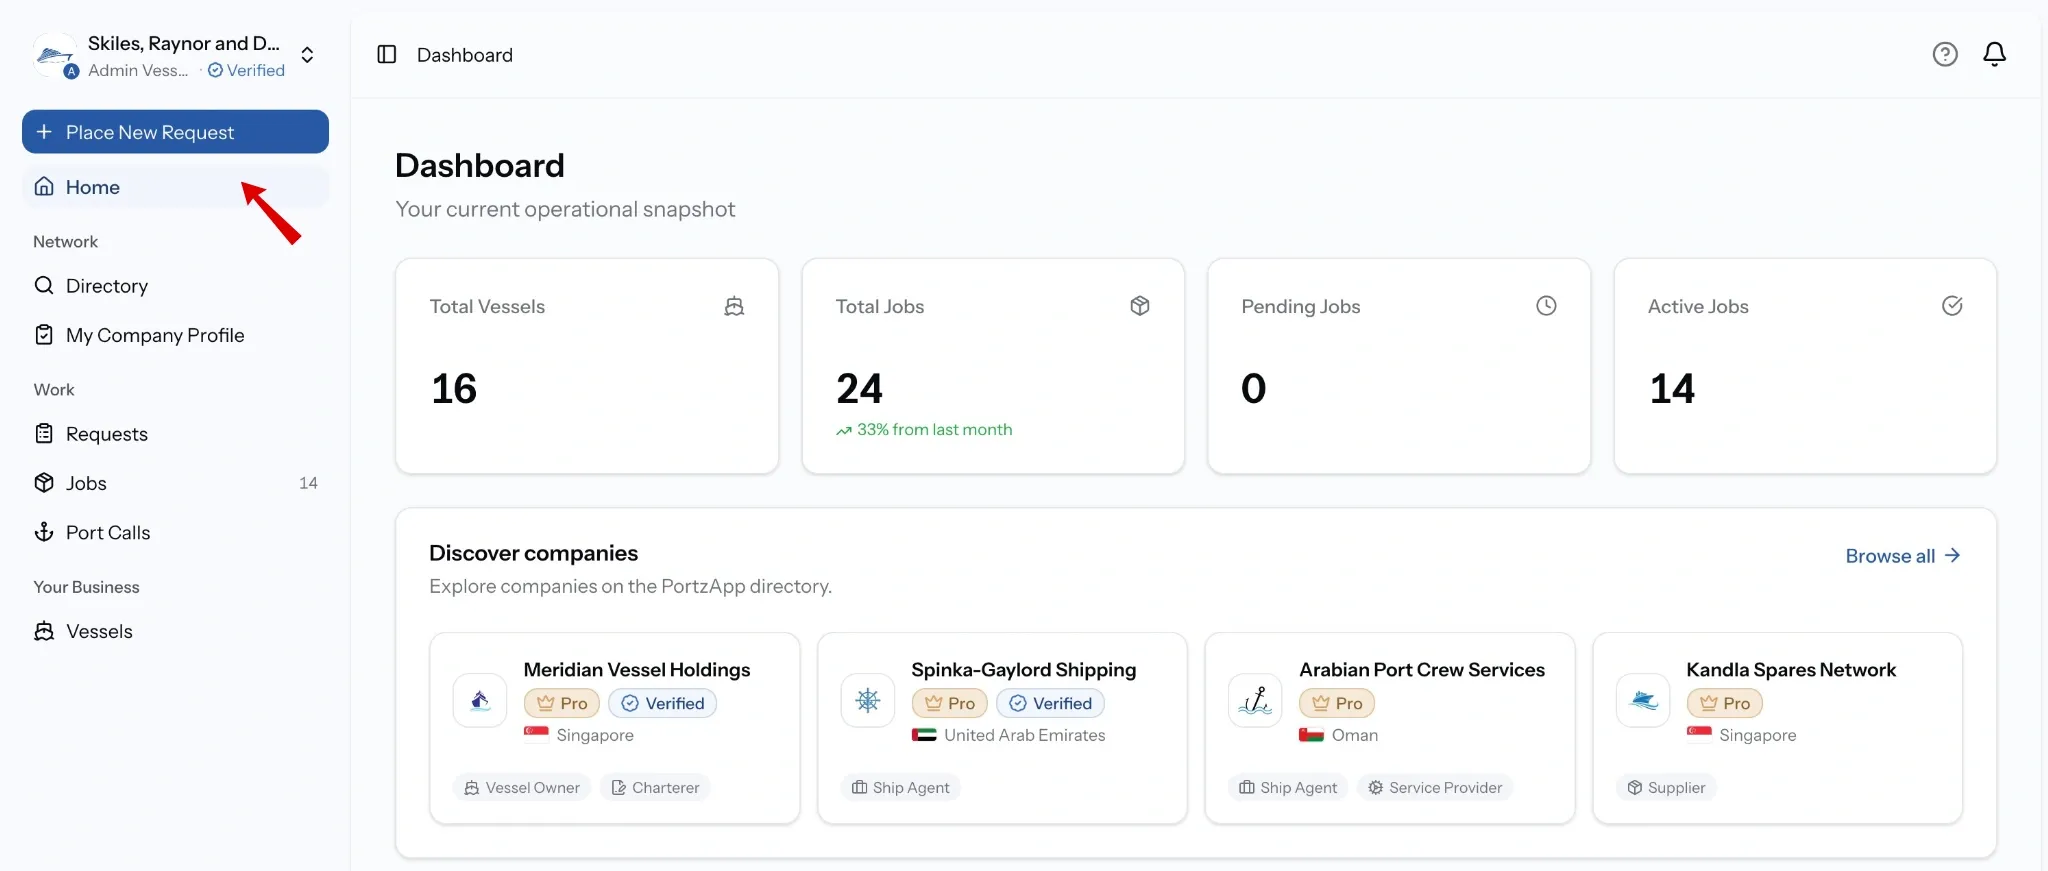
Understanding the counts
Buyers see:
- Total Vessels: how many vessels are in your fleet.
- Total Jobs: every job your organization has, with the change from last month.
- Pending Jobs: work waiting on someone to act.
- Active Jobs: work already under way.

Providers see:
- Active Services: how many of your services are switched on.
- Pending Jobs: work waiting on someone to act.
- Completed This Month: jobs finished this month, with the change from last month.
- Monthly Revenue: revenue this month, in your organization's currency.

Understanding the panels
What appears depends on which side you are on. Buyers and providers share some panels and get their own version of others.
Discover companies
Suggested companies from the PortzApp directory, each with its country, company type, and badges. Browse all opens the directory.
The two badges mean different things. Verified is the company's identity, confirmed by PortzApp. Pro is the plan they are on. A company can carry either, both, or neither.

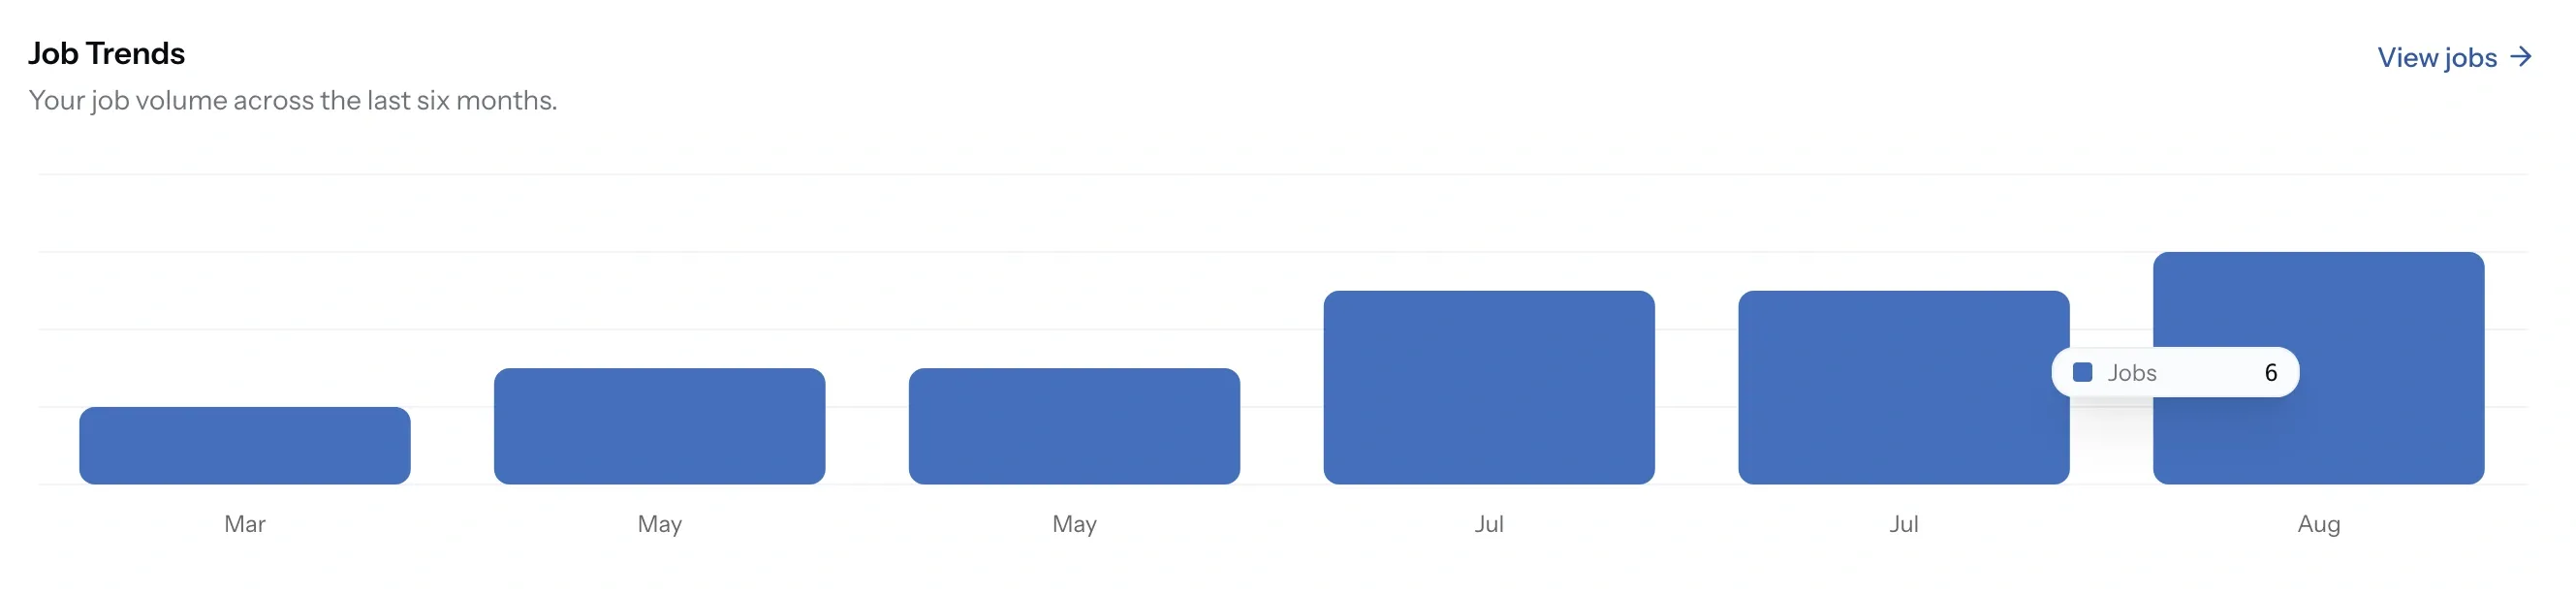
Job Trends
For buyers, six months of job volume, counted rather than valued. Hovering a month gives the exact number, and View jobs opens the full list.
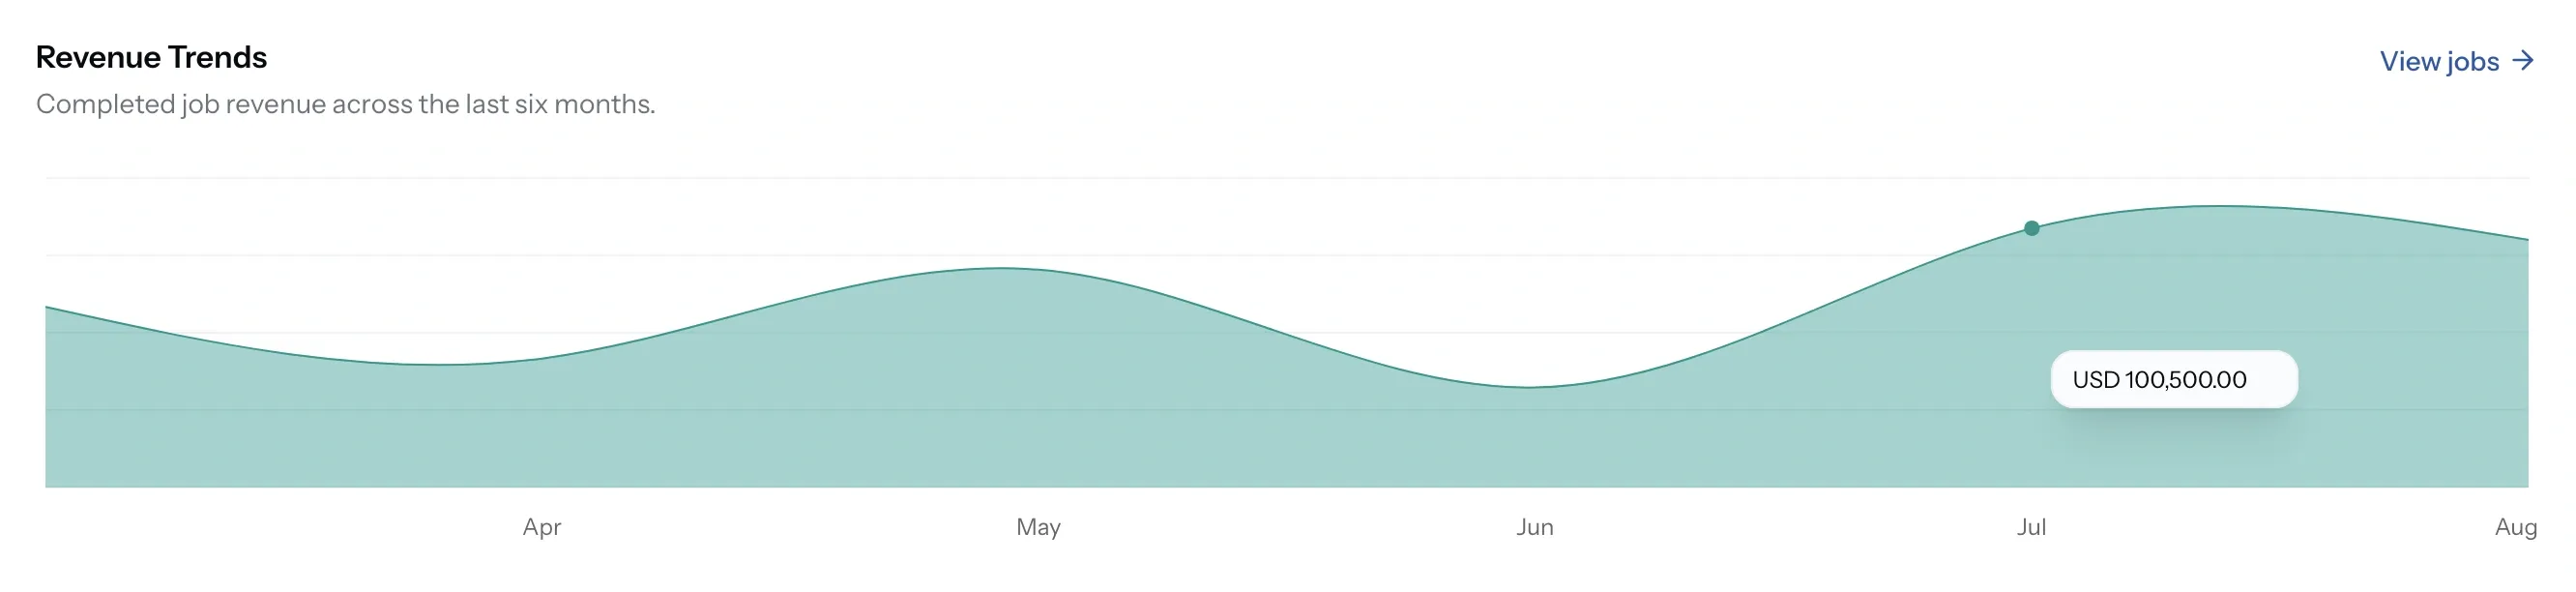
Revenue Trends
For providers, the same six months valued instead of counted. Only completed jobs contribute, so work still running does not appear until it closes, and View jobs opens the list behind it.
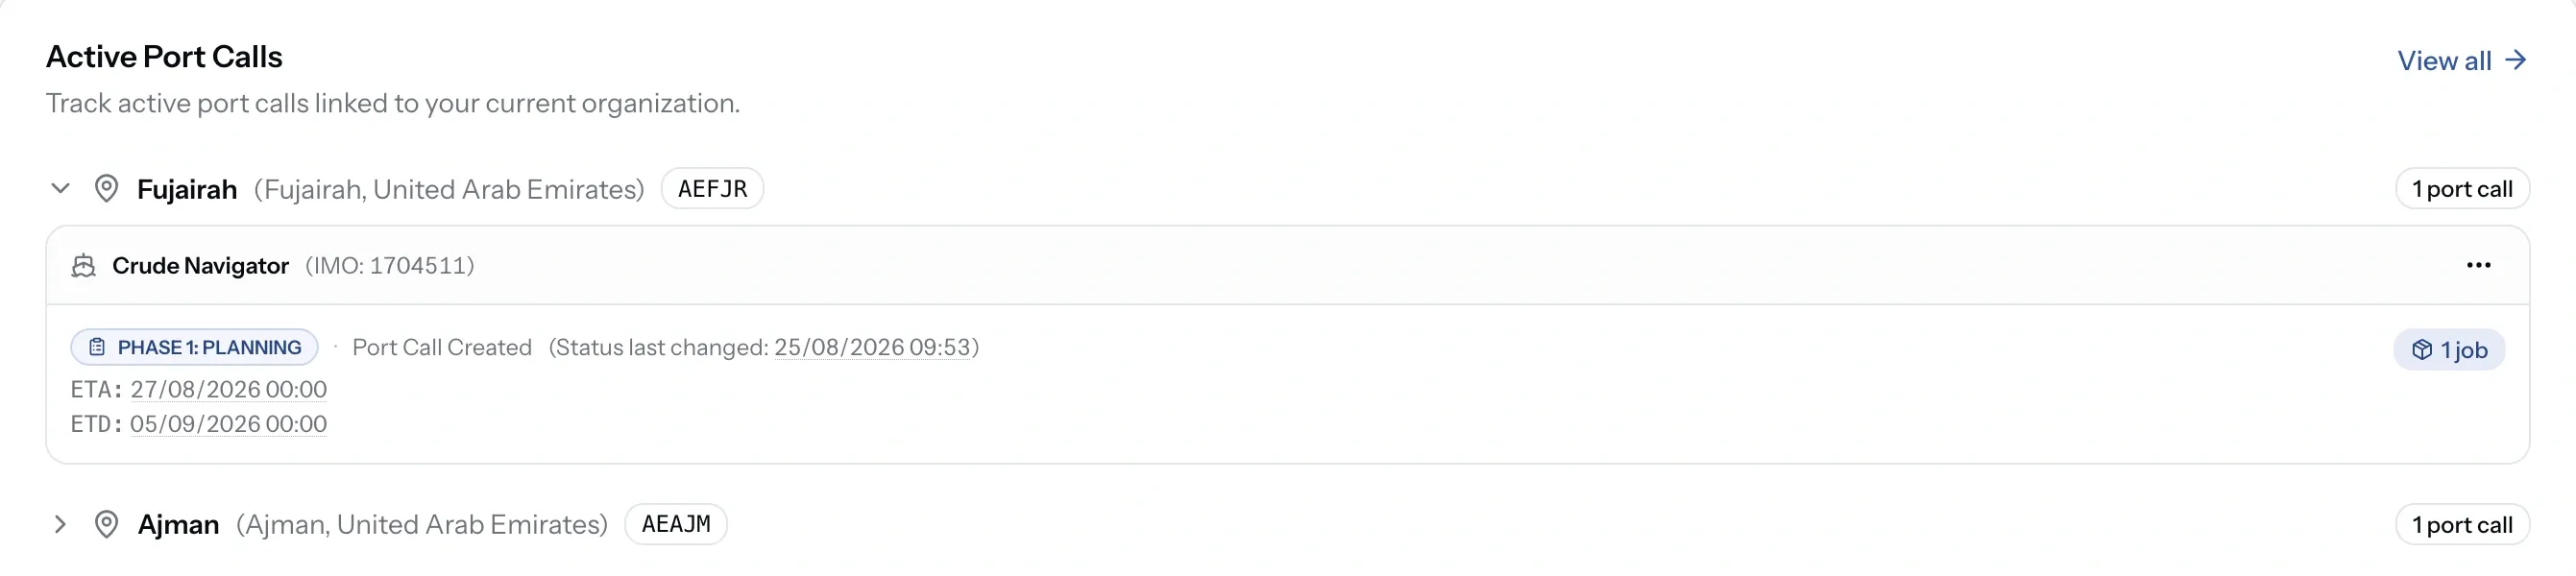
Active Port Calls
Port calls linked to your organization, grouped by port. Expand one to see the vessel, its phase, ETA and ETD, and the jobs attached.
The sidebar
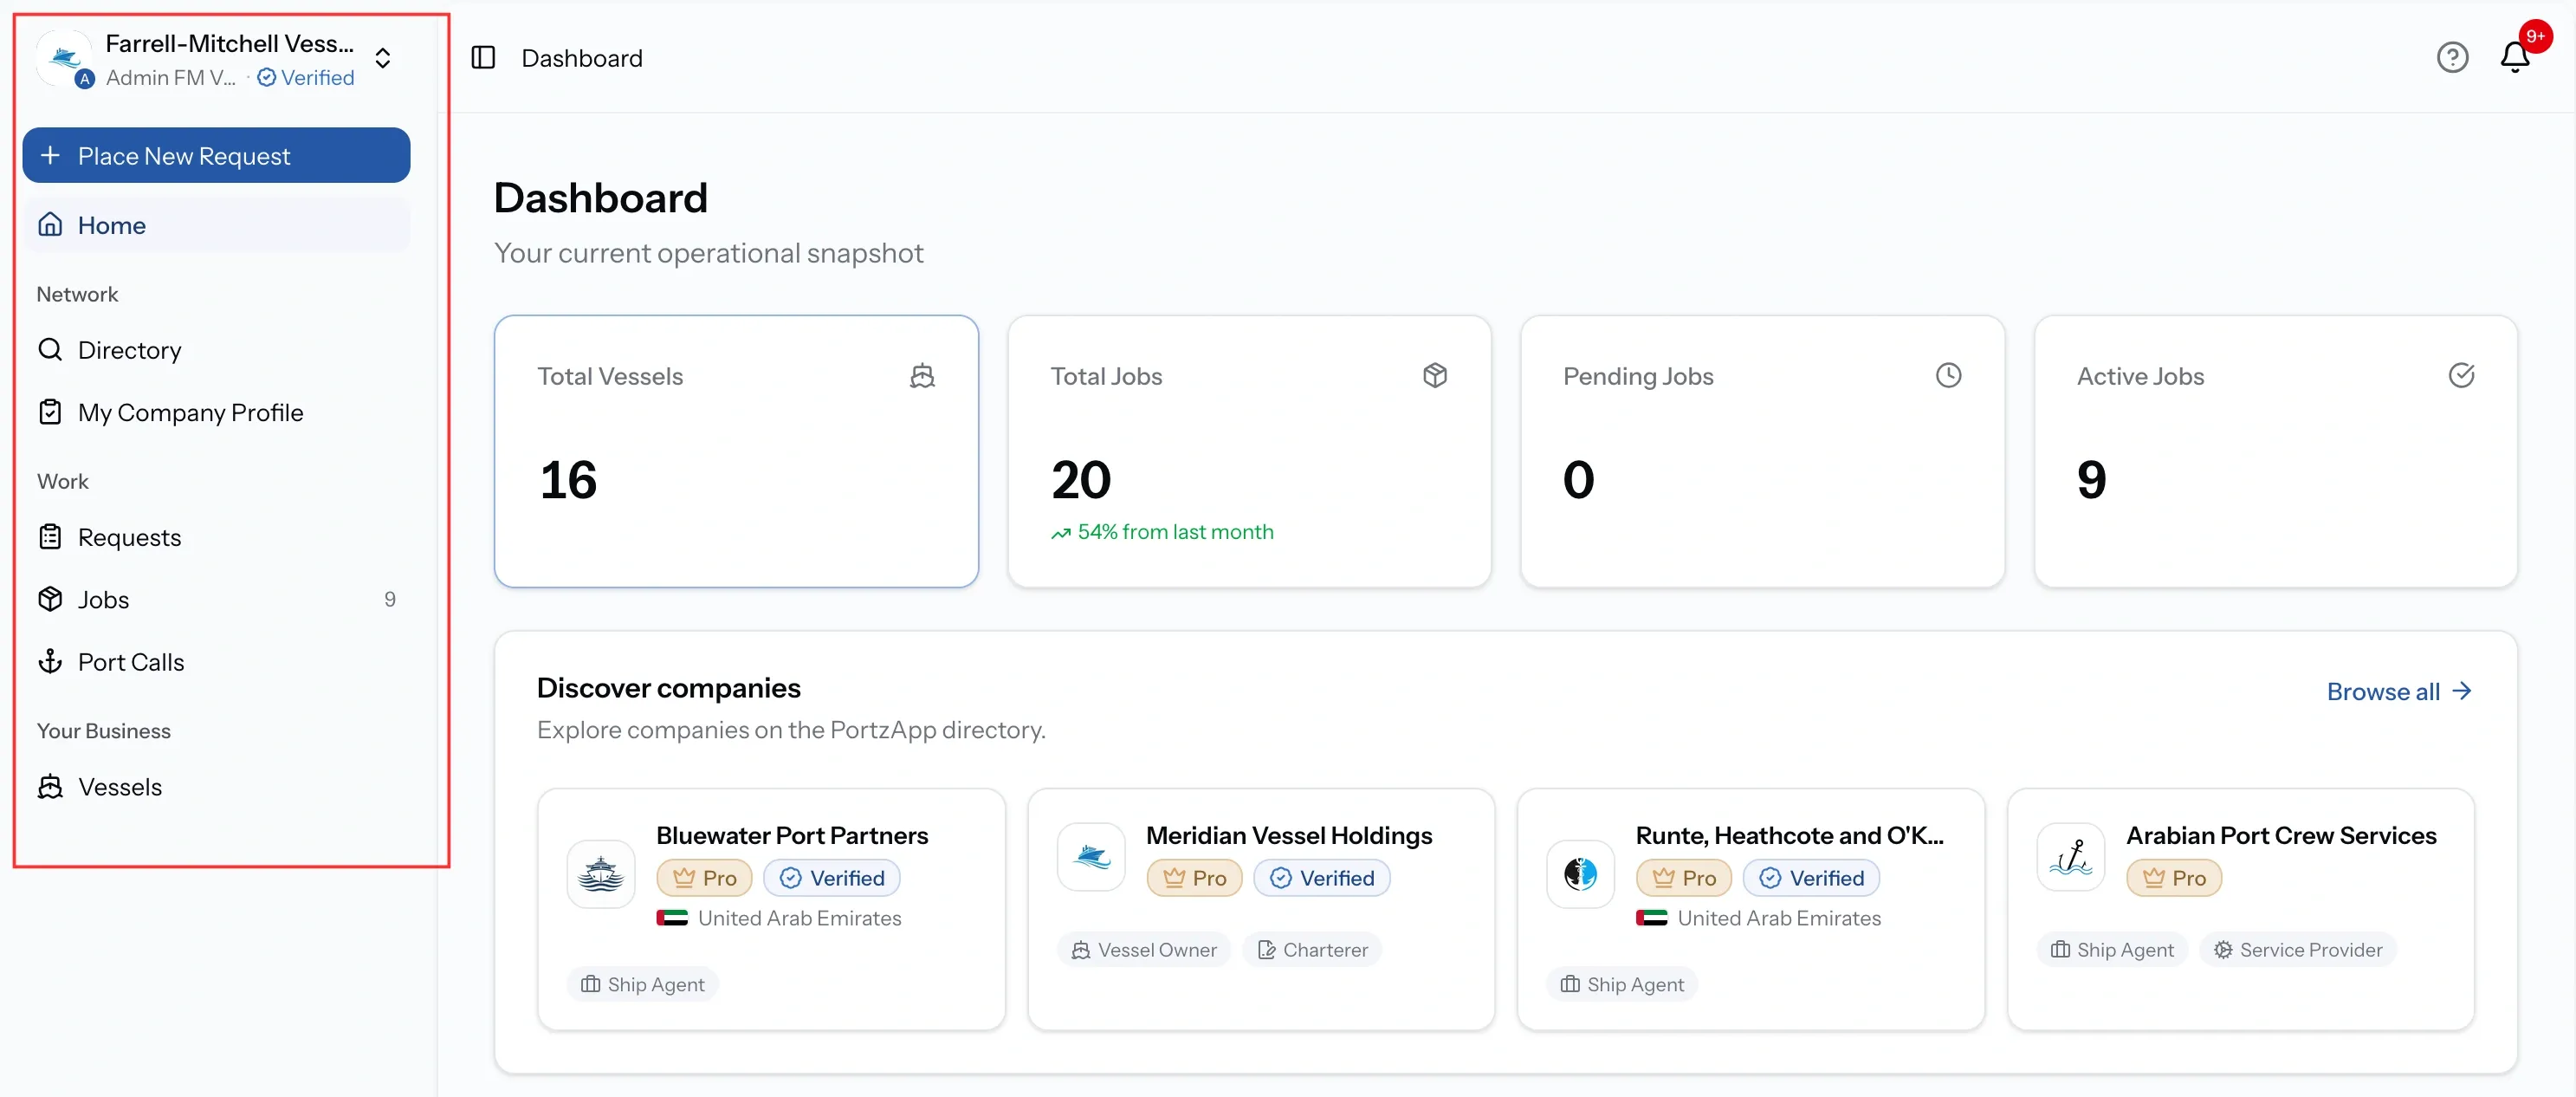
Grouped into Network, Work, and Your Business, showing only what your organization can use. Place New Request sits at the top on every page, and the card above it names your organization, your role, and whether the company is verified.
Counts sit beside the entries with work waiting, so the sidebar doubles as a worklist.
For buyers
The Work group stays short: Requests, Jobs, and Port Calls, with a count beside Jobs. Your Business holds Vessels alone.
For providers
The same three groups carry more inside them. Requests opens into Inbox, Open RFQs, and Sent. Jobs splits into Requested and Servicing, separating what you ordered from what you deliver. Your Business adds My Services and Clients.